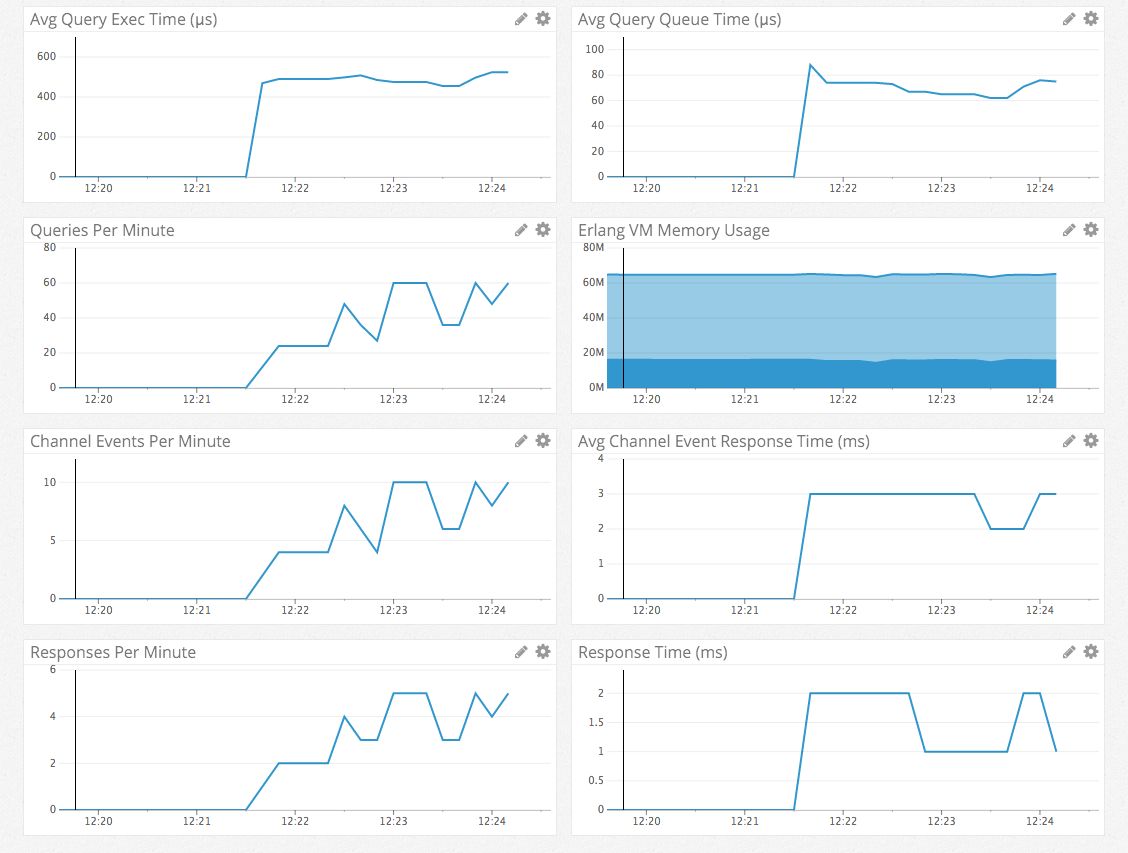
Using Elixometer With Phoenix

Exometer is a great tool for collecting metrics within the Erlang ecosystem. It allows you to easily capture metrics in your application and push those metrics to an aggregator for you to view with pretty graphs. Recently Pinterest released Elixometer, a thin wrapper around Exometer, to make collecting metrics easier within the Elixir ecosystem.
If you're interested in learning how to create a basic metric collection setup with Exometer, Michael Schäfermeyer has a wonderful guide to Monitoring Phoenix. My post extends what he has already provided and uses Elixometer instead of Exometer.
Configuration
Modify your mix.exs config file to add Elixometer as a dependency:
defmodule MyApp.Mixfile do
  ...

  def application do
    [mod: {MyApp, []},
     applications: [
       ...,
       :elixometer,
       :exometer
     ]
    ]
  end

  defp deps do
    [
     ...,
      {:elixometer, github: "pinterest/elixometer"},
      {:exometer, github: "Feuerlabs/exometer"},
      {:exometer_core, "~>1.4.0", override: true},
      {:lager, "~> 3.2.1", override: true}
    ]
  end
As of Sept 13, 2016, these deps should work thanks to Andrew Summers.
Update your config.ex and add Elixometer reporting settings and metrics collection:
memory_stats = ~w(atom binary ets processes total)a

config :exometer,
   predefined: [
     {
       ~w(erlang memory)a,
       {:function, :erlang, :memory, [], :proplist, memory_stats},
       []
     }
   ],
   report: [
     reporters: [{:exometer_report_statsd, []}],
     subscribers: [
       {
         :exometer_report_statsd,
         [:erlang, :memory], memory_stats, 1_000, true
       }
     ]
   ]

config :elixometer,
  reporter: :exometer_report_statsd,
    env: Mix.env,
    metric_prefix: "myapp"
You're configured to start collecting metrics including Erlang VM memory usage. You can add other predefined metrics here that you can't easily capture with Elixometer.
Measuring Ecto
If you're using Ecto version 1.1x, update your repo.ex to use Elixometer:
defmodule MyApp.Repo do
  use Ecto.Repo, otp_app: :myapp
  use Elixometer

  def log(entry) do
    update_histogram("query_exec_time", (entry.query_time + entry.queue_time || 0) / 1000)
    update_histogram("query_queue_time", (entry.queue_time || 0) / 1000)
    update_spiral("query_count", 1)

    super log_entry
  end
end
Query execution time, query queue time, and query counts are now being measured.
If you're using Ecto 2.0.x there's a little more work involved since Repo.log/1 is no longer overridable. Create a file repo_metrics.ex and copy this:
defmodule MyApp.Repo.Metrics do
  use Elixometer

  def record_metric(entry) do
    update_histogram("query_exec_time", entry.query_time + (entry.queue_time || 0))
    update_histogram("query_queue_time", (entry.queue_time || 0))
    update_spiral("query_count", 1)
  end
end
Update your config.ex to use this module for Ecto logging.
config :myapp, MyApp.Repo,
  loggers: [{Ecto.LogEntry, :log, []}, {MyApp.Repo.Metrics, :record_metric, []}]
Now you're set to collect Ecto metrics in microseconds.
Measuring Channels
You might have to do a some more code modifications to measuring channels, but here something to get you started.
defmodule MyApp.SomeChannel
  use MyApp.Web, :channel
  use Elixometer

  # Have all channel messages go to a single point
  @timed(key: "channel_resp_time", units: :millis)
  def handle_in(event, params, socket) do

    # Use a different named function so we can measure messages
    response = handle_event(event, params, socket)

    # update event count
    update_spiral("channel_event_count", 1)

    response
  end

  # Methods that will handle logic
  def handle_event("some:topic", _params, socket) do
     ...
  end

  ...

end
Measuring Controllers
Create a new file elixometer_plug.ex and copy this code (thanks Renan Ranelli for the fix):
defmodule ElixometerPlug do
  @behaviour Plug
  import Plug.Conn, only: [register_before_send: 2]
  use Elixometer

  def init(opts), do: opts

  def call(conn, _config) do
    req_start_time = :os.timestamp

    register_before_send conn, fn conn ->
      # increment count
      update_spiral("resp_count", 1)

      # log response time in microseconds
      req_end_time = :os.timestamp
      duration = :timer.now_diff(req_end_time, req_start_time)
      update_histogram("resp_time", duration)

      conn
    end
  end
end
You can add the plug individually to your controllers or you could apply them to all of your controllers automatically by updating the web.ex file and updating the :controller section:
defmodule MyApp.Web do
  ...

  def controller do
    quote do
      ...

      # Add the Elixometer plug
      plug ElixometerPlug
    end
  end

  ...

end
Wrap Up
Now you're setup to collect metrics in your Phoenix application to give you or your team more insight on your application's performance with very little code change. Hook up your reporter to an application like graphite and see the data flow!
If you have any suggestions or questions, please let me know!